
What do subledgers do?
Dynamics 365 Finance and Operations has a lot of layered functionality in terms of subledger posting through various types of transactions in the system. This is a great way to fully utilize your system and have access to more detailed documentation and keep your financial system running efficiently.
A great functionality in Dynamics 365 is the ability to post expenses to various subledgers throughout the system. Companies post transactions to subledger accounts for several reasons:
-
Detailed tracking: Subledgers provide a more detailed record of transactions than the general ledger. This allows companies to track individual transactions and balances for specific accounts or categories of transactions. This detailed information can be used to identify trends, analyze patterns, and make informed decisions.
-
Accuracy and control: Subledgers help to ensure the accuracy of financial records by providing a system of checks and balances. Transactions are recorded in both the subledger and the general ledger, which allows for cross-referencing and verification. This helps to prevent errors and fraud.
-
Enhanced reporting: Subledgers make it easier to generate detailed reports on specific accounts or categories of transactions. This can be helpful for managers who need to track performance, identify areas for improvement, or make decisions about resource allocation.
-
Compliance and auditing: Subledgers can help companies to comply with accounting regulations and standards. They can also make the auditing process easier by providing detailed records that can be easily verified.
Here are some specific examples of how companies use subledgers:
-
Accounts receivable subledger: This subledger tracks the balances owed to a company by its customers. It includes information about individual invoices, payments, and credit terms.
-
Accounts payable subledger: This subledger tracks the amounts that a company owes to its vendors. It includes information about individual invoices, payments, and due dates.
-
Inventory subledger: This subledger tracks the quantity and value of a company's inventory. It includes information about individual items, purchases, sales, and adjustments.
-
Fixed assets subledger: This subledger tracks the cost, depreciation, and location of a company's fixed assets. It includes information about individual assets, such as computers, furniture, and machinery.
This picture shows some of these various accounts.

Compared to other systems that you can only post to the General Ledger, here with Dynamics 365 you can post to different subledgers to track a project, project budget, and more. Having that control to link paying methods to ledgers is key in Dynamics 365.
This is specifically useful if you have a vendor (for example a credit card) that you use to pay and need to pay, using the vendor functionality to streamline that in the subledger posting is great. This is a helpful feature for midsize clients that need to complete this process.
To learn more about Dynamics 365 Finance and Operations functionality, please reach out to sales@lime-falcon-860444.hostingersite.com or for additional assistance with your systems need contact support@lime-falcon-860444.hostingersite.com.

Developing a Power BI Dashboard to Visualize Outlook
With hundreds of emails crossing your inbox every day, the Outlook mobile app can clutter quickly. Those who have Microsoft Power BI on their mobile devices can easily view their Outlook “Inbox” and “Junk Email” folders.
With some customization, Power BI can aggregate your most important emails into a central dashboard that alerts if you have important e-mails that demand immediate attention. This is especially helpful for frequent business traveling or discretely fielding important emails during meetings. You can build the dashboard yourself by following these steps:
Building the Outlook Dashboard in the Power BI Desktop
The first series of steps is conducted, using the Power BI Desktop. Go to Home > Get Data > Select More:
 Then choose Online Services > Microsoft Exchange Online > Connect.

Enter your e-mail address, and click OK:

As shown within the “Navigator” window, check the box for Mail on the left and then click the green “Load” button in the lower right.

In the empty canvas and on the far right in the “Data” pane, you’ll see the list of fields available to select for this Dashboard:

The final screenshot below shows the completed Dashboard, offering two Slicers at the top and a Table at the bottom showing what e-mails are sitting in my “Inbox” and “Junk Email” folders.
Building this Dashboard required accessing Visualizations on the right and the objects specified in the table, shown below:

|
Visualization |
Icon |
Fields Dragged to Visualization |
|
Slicer |
Importance |
|
|
Slicer |
DateTimeReceived |
|
| Table |
Folder Path, Preview, Subject, DateTimeReceived |
The “Importance” Slicer allows me to choose which e-mails to display in the Table and, specifically, those with “High”, “Low”, or “Normal” Importance or a combination of all three. The “DateTimeReceived” Slicer lets me choose the Table’s date range.
The only other requirement for building the Dashboard is shown in the “Filters” pane, on the right side of the canvas. Here, Advanced Filtering ensures that only “\Inbox\” or “\Junk Email\” is selected for the Table’s “Folder Path” field:

(This filtering was accomplished by, first, clicking on the Table in the canvas.)
Finally, you are free to rename the tab, here we’ll rename it at the bottom of Power BI to “Inbox”:
![]()
Preparing the Dashboard for the Mobile Device
Although reviewing Outlook e-mails within the Power BI Desktop is helpful, it’s not “convenient”. Rather, it’s best to review this data on a mobile device. In the bottom left-hand corner of every Power BI page are two icons:
![]()
The “Desktop layout view” icon is the default selection, as shown by the green line underneath. Choosing the “Mobile layout view” icon, conversely, displays the Dashboard in a mobile canvas.
Once this icon is chosen, you can pull three Visualizations from the “Page visuals” pane on the right and onto a layout resembling a mobile device. Here is the result:

Publishing to the Mobile Device
To see this on your mobile device, you’ll need to publish this to the Power BI Service. This was done by navigating to File > Publish > Publish to Power BI.
The next step is to click the “Publish to Power BI” button:

Any destination may be chosen, but in this example, we selected “My workspace” and clicked Select:

Then you’ll see the below screenshot that it was successfully published to the Power BI Service.

Lastly, you’ll be able to find the dashboard on your mobile device by simply clicking workspaces and selecting the workspace you’d like to view. This will help you be confident heading into a conference call or meeting that day knowing you don’t have any emails requiring immediate attention.
This represents the power of having an Outlook Dashboard available within the Power BI mobile app. For more information on customized Power BI Dashboards please reach out to us at Support@BondConsultingServices.com or you can click here to schedule a free consultation with one of our Dynamics experts.

How to apply a partial payment to an AP invoice
If you have a large invoice entered & posted in Dynamics GP and want to pay part of the invoice, you need to do the following:
(sample invoice)

- Open the Edit Vendor Payment window.

- Enter a Batch ID into the Edit Vendor Payment window and create a new batch, if one does not already exist, and save the batch.

- Next, you will look up, or enter, the Vendor ID.

- After selecting the Vendor ID, you will click on the ‘Apply’ button at the bottom of the Edit Vendor Payment window.

- When you identify the invoice that you want to partially pay, you can enter the payment amount within the Apply Amount field (highlighted in yellow) and the payment will be for that amount only; the balance of the invoice will remain unpaid and can be paid down in parts, or lump sum, in the same fashion on future payments.
You will need to click on the ‘OK’ button to close the Apply Payables Documents window.

- If you click the ‘Save’ button, you will have the option to enter a new payment transaction within the ‘Edit Vendor Payment’ window.
If you opt to print the check for the partial invoice amount, you will need to click on the ‘Print Payments’ button on the bottom, right corner.

- The rest of the check printing process is the same as you would process any other check payment from this point forward.
For more information about Dynamics GP or how to maximize your GP investment, please reach out to us at Support@BondConsultingServices.com or click here to schedule a free consultation with one of our experts.

How to Examine Microsoft Business Central Tables (Deep Dive)
Examining Microsoft Dynamics 365 Business Central tables allows you to:
- conduct steps in troubleshooting performance issues,
- generate reports, and
- review valuable datasets all within one window.
Access the list of tables, by clicking the Tell Me button and entering “table information”:


Here in the Table Information window not only can you review tables’ properties, but you can also even search for and export data to certain applications such as Microsoft Excel.
Table Information displays the amount of data that each table contains and in which company.
Since this window displays the distribution of data size across tables, reviewing this window is useful for troubleshooting performance problems.
The following chart describes the data displayed for each table:
| Column | Description |
| Company Name | The name of the company, if any, that the table belongs to |
| Table Name | The name of the table |
| Table No. | The ID of the table |
| No. of Records | The total number of records stored in the table |
| Record Size | The average record size in KB/record
(This value is calculated using the following formula: 1024(Size)/(No. of Records)). |
| Size (KB) | The total amount of space the table occupies in the database
(This value is the sum of the values in the Data Size and Index Size fields.) |
| Data Size (KB) | How much space the data in the table occupies in the database |
| Index Size (KB) | How much space the table indexes (keys) occupy in the database |
| Compression | The type of compression, Row, Page, or None that is applied to the table in the database |

Clicking “682” in the “No. of Records” column of the Table Information window will display the Inventory Subledger.
Clicking “694” in the “No. of Records” column of the Table Information window will display Inventory Valuation.
Both objects are seen in the two respective screenshots, on the next page.


Security to Table Information
Your Dynamics 365 user account must have the following permissions, to access Table Information:
- Read permission on the table that you want to view and
- Execution permission (direct) on the System object 1350 Run table.
So, place the following Permissions Set in the appropriate User Group:
![]()
Caution: Restrict access to this window because it’s easy to accidentally click the “Data Administration” button in Table Information to pull up a window for deleting data.
If you delete data from a table, Business Central ignites several processes to make sure that everything is cleaned up in your database. The values in Table Information will not update until those processes are complete. This can take a while. The amount of time you'll have to wait can vary, depending on the size of your database.
View a Table Directly within Business Central
To view a table directly within Business Central you add the table=<TableID> parameter to Business Central’s URL, replacing <TableID> with the ID of the table that you want to view.
If your URL starts with https://businesscentral.dynamics.com then, to view the customer master table in your current company, use the following URL:
https://businesscentral.dynamics.com/?table=18
Or, to do so for a specific company such as "CRONUS Inc.", use the following URL:
https://businesscentral.dynamics.com/?company=CRONUS%20Inc.&table=18
Note the use of “&” when table=<TableID> is not located directly after the domain name.
Other Means of Seeing Table Data
Configuration Package
Alternatively, a table is viewed by clicking “Export to Excel” within a Configuration Package:

bcentral.dev
The bcentral.dev domain name provides a comprehensive listing of tables and the fields within them:
https://bcentral.dev/nav/2018/w1/

Clicking the “Bank Account” folder on the left displays the following:

Now, clicking “Bank Account Ledger Entry” displays this information:

Page Inspection
You will see data by clicking “View table” within Page Inspection:

Specific Use Cases
Auditing
In the vendor card, click Business Central’s question mark icon in the upper right-hand corner. Then, choose Help & Support:

Click the green “Inspect pages and data” hyperlink, appearing within the “Troubleshooting” section.
Scroll down to the bottom of Page Inspection, and you will see “SystemCreatedBy” and “SystemModifiedBy” on the right:

Reporting
Reviewing Page Inspection to find a table’s name and number can be used in such reporting tools as Excel and Power BI.

Above, Page Inspection shows that open purchase orders reside within the Purchase Header (38) table.
Armed with this information, you would type “web services” in the Tell Me button and create an OData link so that you can pull open purchase orders into Power Bi. (You may need multiple tables such as a header and detail.)
For any questions you may have about Business Central, please reach out to us at Support@BondConsultingServices.com or click here to schedule a free consultation with one of our experts.

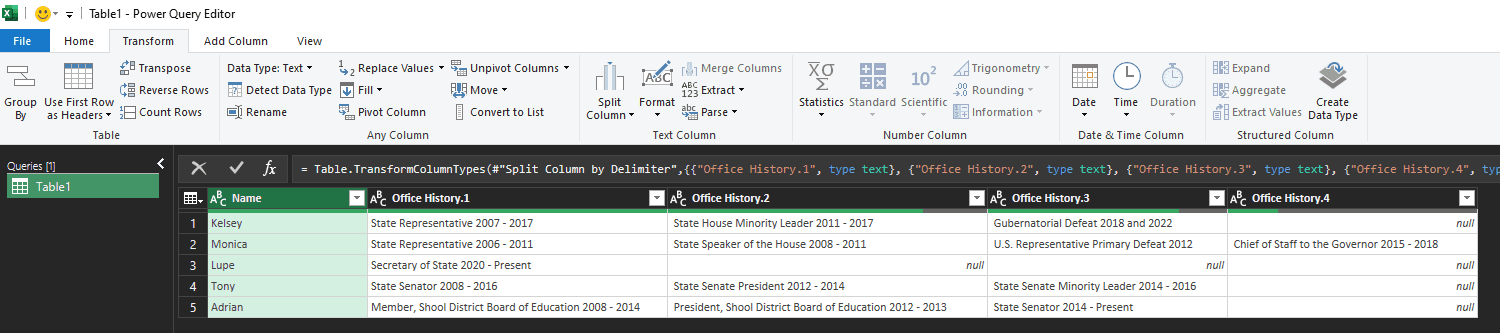
Setting Up Your Data For Import
When we are working with a client towards an implementation, there is usually a lot of data to import from the old to the new environment. This data import is vitally important to the continuity of your business, so to ensure all the data is transferred correctly we send out Excel Import Templates. Any data that doesn't fit neatly into the import template needs to be cleaned and organized to allow for seamless migration into the custom environment.
Many clients have multiple data points stored in a single notes field that needs to be maintained in the new environment as separate table records. The example below uses a separator, or "delimiter", to split the data within the notes. The delimiter provides an easy way to parse the data so it can be easily imported.
For example, this table shows notes data about the Office History of certain individuals.

First, on the desired data table, select From Table/Range. This opens the Excel Power Query Editor.
 Next, select the column with the data that needs reformatting. Then navigate to the Transform tab and select Split Column > By Delimiter.

Select the Delimiter and choose “Each occurrence of the delimiter” for the frequency.

This will split the data at each punctuation mark, separating each entry into more columns that then can be linked to the correct data.
 Lastly, navigate to the Transform tab and select “Unpivot Columns” > “Unpivot Other Columns.”

Your data is now ready to be imported! This format is much easier to transfer and will save you a lot of time with bulk imports. This method is widely applicable and since you can prepare it yourself, you reduce the overall cost of your implementation.

For any questions about this process or how to maximize your Dynamics 365 investment, please reach out to us at Support@BondConsultingServices.com, or click here to schedule a free consultation with one of our Dynamics experts.

Auditing Security and End User Updates
Field Level Security
Microsoft Dynamics 365 Business Central lets you monitor important fields and be notified by email when someone updates a field. This provides, in essence, “field level security” for Business Central. To specify the fields that you want to monitor, click the “Tell Me” button, type “assisted setup”, and click the hyperlink for “Assisted Setup”.

Next, click “Set up field monitoring”.
This will launch the wizard for the Field Monitoring Assisted Setup Guide.
Clicking “Next” on the first page of the wizard takes you to “Let’s Get Started”:

The above window means that you may choose to monitor fields based on their Data Classifications, as follows:
- Sensitive – private data (i.e., political, or religious beliefs)
- Personal – any data that can be used to identify an end user
- Company Confidential – business data that you want kept as a secret (i.e., ledger entries)
If you do not want to make any selections at this time, simply click “Next”.
The final section of this article discusses these Data Classification settings, in more detail.

In addition to choosing the Business Central user who will be notified when someone changes the value in a field, choose the “Notification Email Account” containing that user’s e-mail address.

Clicking “Finish” not only opens the Monitored Fields Worksheet window but, also, generates the following e-mail:

Once the Monitored Fields Worksheet opens, choose the tables and fields to monitor.

Choosing Table No. 79 and Field No. 22 and clicking “Notify”, as shown above, means that any changes to the “Ship-To Name” field in the “Company Information” window will generate an e-mail to the “ADMIN” user in Business Central.
Important Note: You must sign out of Business Central and sign in, again, for it to take effect.
In this example, we’ll be changing the Ship-to Name of 3Q LLC.

If an end user accessed the Company Information window of the 3Q LLC company and removed “LLC” from this field, the following e-mail would be sent to ADMIN:

Then, if you return to the Monitored Fields Worksheet > Select “Field Change Entries” at the top of the worksheet to open the “Monitored Field Log Entries” window:

This log shows that ADMIN changed the value of Ship-To Name from “3Q LLC” to “3Q”. Although ADMIN changed the Ship-To Name in this example, a different user would typically have made this change.

Change Log
Business Central’s Change Log, also, provides for field monitoring “light”. The Change Log, however, doesn’t transmit e-mails. To open the “Change Log Setup” window, click the “Tell Me” Button, type “change log setup”, and click the “Change Log Setup” hyperlink:

Before selecting Change Log Activated, choose the table and field that you want to track in the log. This is done by navigating, within the “Change Log Setup” window, to Setup (Table) List:
 In the “Search” button in the upper left, type “company information”:

Select “Some fields” in the “Log Modification” drop-down list, and click its ellipsis button:

Once Ship-to Name is found as shown above, check the “Log Modification” box.
Return to Change Log Setup, to enable the Change Log:

After choosing to close the window, click “Yes” to the following message:

Just as Field Monitoring does, Change Log Entries shows that ADMIN removed “LLC” from Ship-to Name in Company Information:

Note: Using the Change Log can hinder performance and increase the size of the database. Users lose time, and time is money. To save money, then, take the following steps:
- Do not add ledger entries and posted documents but, instead, prioritize system fields such as Created By and Created Date;
- Use the “Some Fields” Tracking Type and not “All Fields”; and
- Track only the most important fields.
Troubleshooting Security
If you’re having issues in investigating and eliminating problems with user security, review Effective Permissions. Open the “Users” window using the “Tell Me” button, type “users”, and click the “Users” hyperlink:

We’ll click on a User Name, such as “ACCOUNTING”:

Next, click the “Effective Permissions” button in the User Card:

The “Permissions” part lists all of the database objects that the user has access to. This section cannot be edited.
The “By Permission Set” part shows the assigned Permission Sets through which the Permissions are granted, the source and type of the Permission Set, and to which extent the different Access Types are permitted.
The five Access Types are “Read Permission”, “Insert Permission”, “Modify Permission”, “Delete Permission”, and “Execute Permission”.
For each row that you select in the “Permissions” part, the “By Permission Set” part shows which Permission Set or Sets that the Permission has been granted.
To edit a Permission Set, select a “By Permission Set” part.
Next, click the “Permissions Sets” button to display the “Permissions Sets” window:

Here, we’ll select the “BANKING AND FINANCE” User-Defined Permission Set and click the “Permissions” button. The “Permission Set” window will appear:
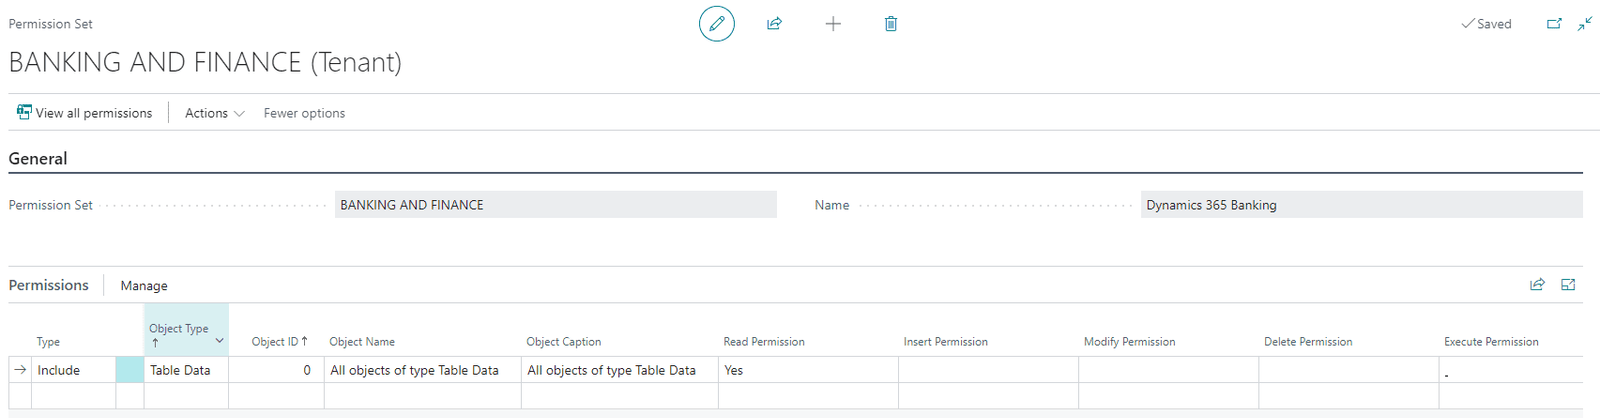
Here, you can edit the value in each of the five access type columns: Read Permission, Insert Permission, Modify Permission, Delete Permission, and Execute Permission.
To edit the Permission Set, click on one of the drop-down lists and select a different value:

Important Note: When you edit a Permission Set, the changes will also apply to other users that have the permission set assigned.
If you don’t want to make changes to the Permission Set but want to simply view the tables that the Set has access to, simply click the “View all permissions” button.
Data Classification Worksheet
In the first section of this blog article, we discussed monitoring fields. There, we discussed the Data Classification Worksheet.
As shown at the top of the worksheet, Microsoft issues the following disclaimer:
“Microsoft is providing this Data Classification feature as a matter of convenience only. It's your responsibility to classify the data appropriately and comply with any laws and regulations that are applicable to you.”
At the top of this window, you can access the “Process” and “View” menu selections that perform the following respective tasks:
Process:
Set Up Data Classifications – classify fields based on sensitivity
Find New Fields – search for new fields and add them to the worksheet
Set as Sensitive – set fields to “Sensitive”
Set as Personal – set fields to “Personal”
Set as Normal – set fields to “Normal”
Set as Company Confidential – set fields to “Company Confidential”
Set as Unclassified – set fields to “Unclassified”
Show Field Content – shows the values contained within the field
View:
View Similar Fields – view fields with similar names
View Unclassified – view only unclassified fields
View Sensitive – view only sensitive fields
View Personal – view only personal fields
View Normal – view only normal fields
View Company Confidential – view only confidential fields
View All – view all fields
For questions about this process or how to streamline your Business Central environment please reach out to us at Support@BondConsultingServices.com or click here to schedule a free consultation with one of our experts.

How-to Setup the Late Payment Prediction Tool in Business Central
The Late Payment Prediction Tool for Microsoft Dynamics 365 Business Central reduces outstanding receivables by using artificial intelligence to predict whether Sales Invoices will be paid on time.
Upon entering a Sales Invoice, navigate to Actions > Other > Predict Payment:
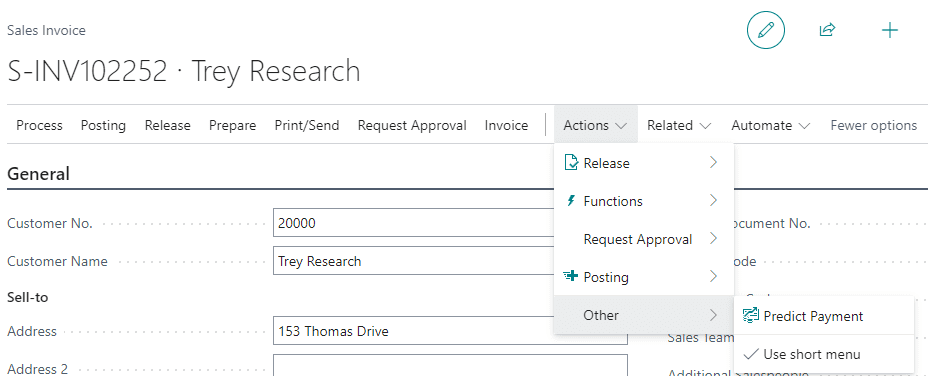

This prediction action also works on Sales Quotes and Sales Orders.
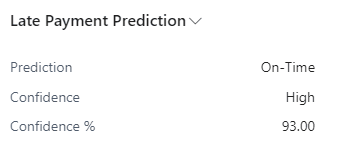
After posting the Sales Invoice, navigate to Customer Ledger Entries to find three prediction fields on the right:

Payment Prediction will show as either On-Time or Late.
Prediction Confidence displays any of the following three values:
- High means that the prediction is at least 90% accurate,
- Medium is between 80 and 90%, and
- Low is below 80%.
Prediction Confidence % specifies the percentage that the confidence value is based upon.
Note: Use Business Central’s Personalize setting if these fields aren’t already appearing.
The Customer Ledger Entries FactBox on the right shows these three fields, as well:
With this information, the Collections Department can take action. For instance, if the Tool predicts that a payment is going to be late, Collections can adjust Payment Terms or change the customer’s Payment Method.
Collections, therefore, will chase the real issues causing bills to remain outstanding instead of wasting time using other methods of doing so.
By saving time, the Tool saves money!
To report on “Late” activity, you can create a filter in Customer Ledger Entries as shown in this example:

From there, you can export the filtered results to Microsoft Excel.
Late Payment Prediction Setup
To turn on “Late Payment Prediction”, click the magnifying glass and search:

On the left-hand side of the Late Payment Prediction Setup window, click “Enable Predictions”:
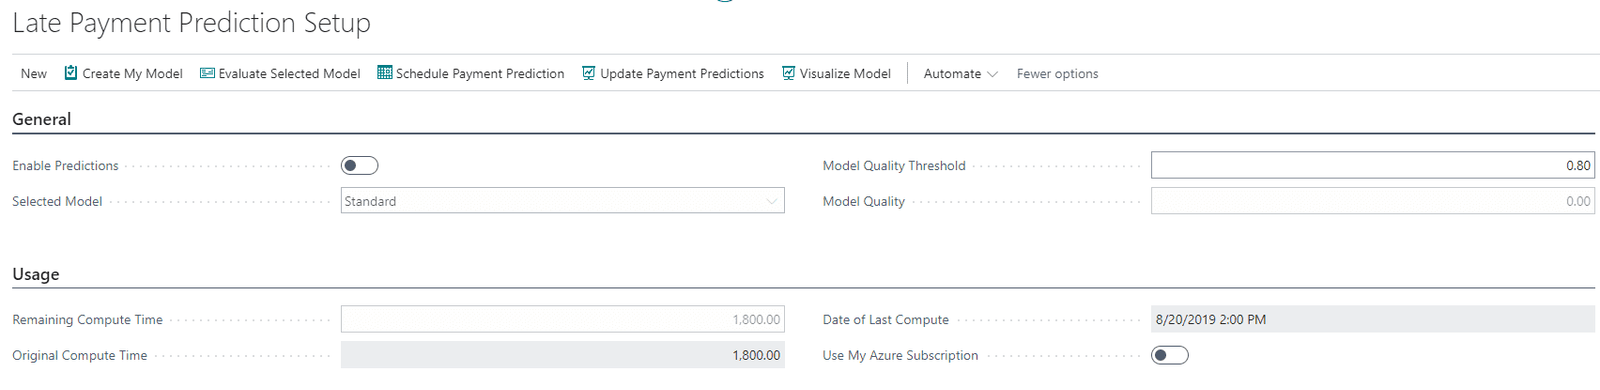
If you receive the error message shown below, click “Refresh" (F5) and update the window’s Model Quality Threshold to the suggested value:

Then, click Enable Predictions again.
Note: You may need to tab through the window multiple times, to successfully enable predictions.
Click “I accept”, within the terms and conditions window that appears. Then, you’ll see the following notification at the top of Customer Ledger Entries:

When clicking “Enable Scheduled Payment Predictions” as shown above, you’ll see the following message:
 You can add the three Prediction fields mentioned earlier using Personalize.
When first enabling this Tool, these three fields will display data only for Sales Invoices posted from that moment forward. Data won’t appear for invoices posted prior to enabling the Tool.
Enabling predictions, in this way, allows for the Tool to be updated daily. If you need to make changes, return to Late Payment Prediction Setup and click ![]() .
.
Then, you can modify the Tool's Job Queue accordingly:

How Accurate is Late Payment Prediction?
Late Payment Prediction derives its data from a “machine learning classification model”. The quality of the model indicates the accuracy of its predictions.
For example, if there isn’t enough data (i.e., paid and late invoices) or if the data doesn’t contain enough variation, accuracy of the model is delayed.
You can swap out the Standard model for one of your own, in just a few steps.
In fact, the Tool lets you continue to train your model as you accumulate data. This sharpens predictions of the payment habits of customers.
To begin the process of swapping models, click the ![]() button found at the top of Late Payment Prediction Setup.
button found at the top of Late Payment Prediction Setup.
When you first click the button, you’ll receive a message like the following:

Once you click “OK” to this message, the Selected Model drop-down list becomes available to allow you to choose “My Model” instead of the default of “Standard”:

This completes the process of swapping models.
In addition, you can click ![]() in the future to use a different model. You’ll receive a message similar to this:
in the future to use a different model. You’ll receive a message similar to this:

If you’d like to have Business Central review the accuracy of your model, click ![]() and review this subsequent message:
and review this subsequent message:

To immediately see the effect of changing models, ensure that you click ![]() .
.
Doing this updates Customer Ledger Entries, as shown by the following message:

Click ![]() , to download a PDF document showing the current model used:
, to download a PDF document showing the current model used:

These bullet points outline the ERP data used to update and evaluate the model used by the Tool:
For each customer ledger entry that has a related Posted Sales Invoice
- Amount (LCY) including Tax
- Payment terms in days is calculated as Due Dateminus Posting Date.
- Whether there is an applied credit memo.
The record is enriched with aggregated data from other invoices related to the same customer
- Total number and amount of paid invoices
- Total number and amount of invoices that were paid late
- Total number and amount of outstanding invoices
- Total number and amount of outstanding invoices that are already late
- Average days late
- Ratio: Number Paid Late/Paid invoices
- Ratio: Amount Paid Late/Paid invoices
- Ratio: Number Outstanding Late/Outstanding invoices
- Ratio: Amount Outstanding Late/Outstanding invoices
The information about the customer isn’t included in the dataset.
You can also create your own predictive web service, based on a public model named Prediction Experiment for Dynamics 365 Business Central. This predictive model is available online in the Azure AI Gallery. To use this model, follow these steps:
- In Late Payment Prediction Setup, click New and "Open Azure AI Gallery".
- Search for Prediction Experiment for Dynamics 365 Business Central, and open the model in Azure Machine Learning Studio.
- Use your Microsoft account to sign up for a workspace, and copy the model.
- Run the model, and publish it as a web service.
- Make a note of the API URL and API key. (You’ll use these credentials for a cash flow setup.)
- Click the Search Magnifying Glass, enter Late Payment Prediction Setup, and choose the related link.
- Click the Use My Azure Subscription
- On the My Model CredentialsFastTab, enter the API URL and API key for your model.
For any questions about setting up your Late Payment Prediction Tool or how to maximize your Business Central investment please reach out to us at Support@BondConsultingServices.com or click here to schedule a free consultation with one of our experts.

Performing Financial Health Checks in Business Central
When it comes to accessing your financial data, Business Central is one of the most powerful engines you can install to drive your business forward. Making sure everything is well maintained and operating at peak performance is key to continue delivering the best results for your business.
That’s where a monthly financial health check can add immense value. A health check is a simple way to see whether your GL is in balance with your Sub-ledger for AR, AP, Inventory and Payroll.

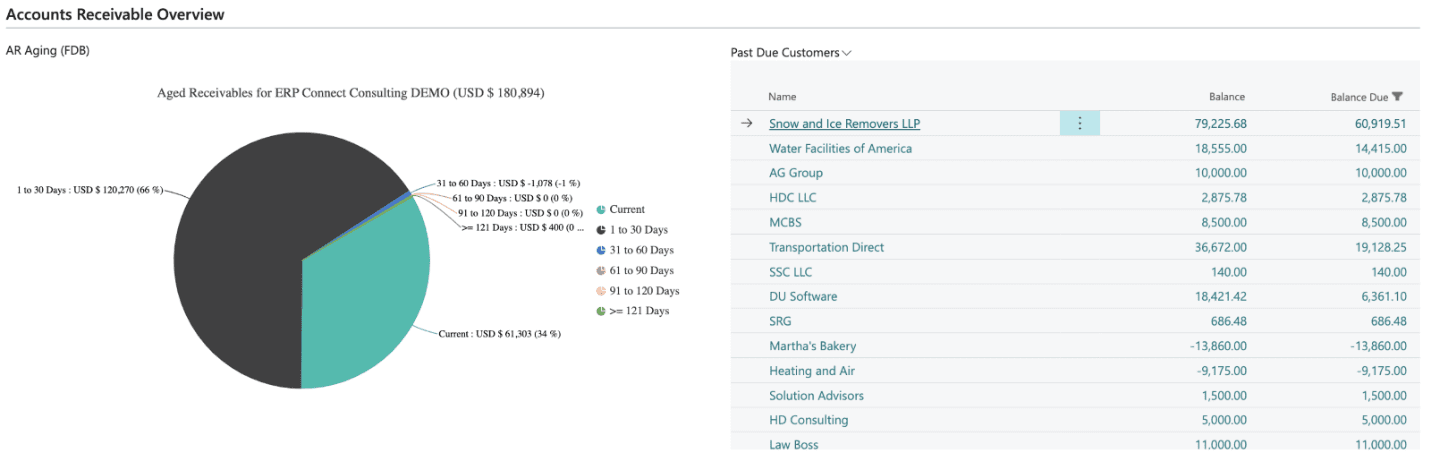
With ERP Connect’s Financial Dashboard, the Balance Check module is just the start. As a business owner, your team will have access to over 35 different KPIs focused around:
- GL – Balance Checks, KPIs, and Financial Reports
- AR – Aging charts, overdue customer summary, detailed customer trial balance (Image Below)
- AP – Aging charts, overdue vendor summary, detailed vendor trial balance
- Inventory – valuation insights, inventory warnings, and analysis statistics
- Sales – Overviews by dimension, top customers, top items, profitability, and more
- Cash – Cash positions, balance checks, historic cash trends, future forecasting
Every module within the Financial Dashboard is built natively into Business Central and meant to give your team a holistic view of your company at a glance. Now you will have the tools to diagnose any issues with your business and ensure it is operating at peak financial efficiency.
If you are interested in a 30 day free trial of ERP Connect's Financial Dashboard, please reach out to us at Support@BondConsultingServices.com or you can click here to schedule a free consultation with one of our Dynamics experts.

How can I use Microsoft Copilot to help me code?
In recent years, Artificial Intelligence (AI) has made significant strides in various fields, and the world of software development is no exception. Microsoft Copilot, a groundbreaking AI-powered coding assistant, has emerged as a game-changer in the coding landscape. Developed by Microsoft in collaboration with ChatGPT’s OpenAI, Copilot is a state-of-the-art AI tool designed to assist developers in writing code more efficiently and effectively. Microsoft Copilot is built on GPT-3, a generative language model that has been trained on a vast dataset containing a wide range of coding languages, frameworks, and patterns. This extensive knowledge enables Copilot to understand and generate code across multiple programming languages, making it a versatile and powerful tool for developers from various backgrounds.
Enhanced Code Suggestions and Autocompletion
One of the most impressive features of Microsoft Copilot is its ability to provide real-time code suggestions and autocompletion as developers type. Copilot leverages its vast knowledge of programming patterns and best practices to generate relevant code snippets, reducing the need for repetitive typing and minimizing human error. This feature not only saves valuable time but also enhances code quality, as Copilot often offers optimized solutions based on the context of the code being written.
Support for Multiple Programming Languages and Frameworks
Gone are the days of juggling different coding tools from various programming languages. Microsoft Copilot supports a wide range of languages, including those most popular like Python, JavaScript, C++, Java, and many more. Additionally, it also caters to various frameworks, enabling developers to seamlessly switch between projects without losing productivity. This versatility makes Copilot an invaluable companion for coders working on diverse projects.
Context-Aware Code Generation
Unlike traditional code autocompletion tools, Copilot can comprehend the context in which the code is being written. By understanding the project structure and the developer's intention, Copilot generates code that fits seamlessly within the existing codebase. This context-awareness minimizes the need for manual code adjustments, streamlining the development process and reducing the chances of introducing bugs.
Collaborative Coding
Microsoft Copilot can be used collaboratively, making it an excellent tool for pair programming or team projects. The AI assistant can suggest code snippets based on the combined knowledge of all developers working on the project, thereby enhancing the overall productivity and ensuring a consistent coding style throughout the team.
Microsoft Copilot represents a significant step forward in the world of software development. Its AI-powered capabilities. As AI continues to evolve, we can expect Copilot and similar tools to redefine the coding landscape, empowering developers to build more sophisticated and robust applications with greater ease and efficiency. Embracing AI assistance in coding not only saves time but also enables developers to focus on the creative aspects of their work, leading to a brighter and more innovative future for the software development industry.

How can I Find Data in Documents
Business Central has one of the best and most intuitive search engines that will give you results even when you have some typos.
For example, to find Purchase Invoices, you can type:
- P Inv
- Pur Inv, or even
- Inoice or puchase or innoice
Either typo can still give you the correct result.

What about looking for a document? Wouldn't it be great to enter a text and get the documents containing that text? Good news! It's possible with the new "Search in Company Data" feature in Business Central.
Search "Find company Data"; feel free to include a few typos, to find "Search in Company Data."; alternatively, use Ctrl + Alt + F to open it.

This feature is currently in preview in Business Central Wave 1 2023 (version 23); useful for finding documents.
For example, it's time to reorder coffee, but you cannot remember the vendor who sold you that tasty and aromatic cup of coffee you just had.
Enter in the Text to Search Box the text you want to find and press Enter.

Business Central will display different results; choose the result that might answer your question to open the related entry, item, or document.
The "Show tables to search" option in the Results menu allows you to select the tables used in searches. If one result adds too much noise as it displays records you are not interested in finding, uncheck the box for that table and try the search again. And if you know a particular result is missing, add extra tables as needed using the "Show all tables" action in the Actions menu.


The set of Default Tables is predefined per Profile or Role Center and is tailored to find the most relevant data for each Role Center.

For more information about this topic please reach out to us at Support@BondConsultingServices.com or click here to schedule a free consultation with one of our experts. Or check out what Microsoft has posted about the capability.