
Using a Reporting Currency in Business Central
In this blog we will be highlighting the steps in implementing additional reporting currency in Dynamics 365 Business Central. The benefit of additional reporting currency is users can view the balances and net change on the Chart of Accounts page in local currency as well as foreign currency.
Step 1: Update Currency Card:
Update G/L account in Realized G/L Gross Account, Realized G/L Losses Account, Residual Gains Account and Residual losses Account.


Step 2: Search for Chart of Accounts in Global Search and select appropriate link. Update Adjust Additional Currency Amount in Chart of Accounts.

In “Reporting” tab, select “Adjust Additional Currency Amount”.

Link this, all the required G/L Account in “Chart of Accounts” page need to be configured (as shown above).
Step 3: Enable the “Additional Reporting Currency” feature in “General Ledger Setup”

Now, when you go and view the Chart of Accounts, where you can see the “Additional Currency Net Change” field is automatically updated. Net Change will show the values in Local Currency and Additional Currency – Net Change will show the value in Additional Reporting currency as per setup in General Ledger Setup.

Step 4: Select the “Adjust Exchange Rate” batch job report
Currencies > Process > Adjust Exchange Rate


Since the exchange rates fluctuate often, we need to run this job/function “Adjust Exchange Rate” similarly often to correctly post the General Ledger entries and to ensure the relevant account is adjusted and updated. For any questions about these steps or if you are struggling with your current Dynamics 365 environment, please reach out to Support@BondConsultingServices.com for more info. Or you can click here to schedule a free consultation with one of our Dynamics experts.

Query cannot be previewed due to the following problem - there are no columns defined
We recently came across a case where Integration Manager was not able to read any records despite the fact that the source file referenced in the integration was correct and contained valid data when the file was opened in Notepad.

When we tried to preview the file contents, we received the following message:

For whatever reason Integration Manager does not like multiple periods in the file name, which originally was ‘Invoices_MM.DD.YYYY.csv’. After removing the periods that were used as separators in the file name, the file was correctly read by Integration Manager as we had initially expected. If you are still encountering a similar problem, please reach out to us at Support@BondConsultingServices.com for an appropriate solution recommendation. Trust in the expertise of BCS to optimize your ERP investment.

Using Advanced CRM included with Business Central
Customer Relationship Management is an increasingly important tool in a business' repertoire to facilitate growth. It is easier and more financially worthwhile to retain an existing customer rather than acquiring a new customer. Usually, BCS recommends Microsoft Dynamics 365 Sales as a fully loaded CRM solution, but some businesses do not require such a robust environment.
"Advanced CRM," developed by ERP Connect Consulting, fulfills a similar CRM role within Business Central at a reasonable price and with the following capabilities:
- Contacts can be divided into the three stages of the sales cycle – Lead, Opportunity, and Customer
- Mass e-mailing through marketing campaigns
- A robust and intuitive user interface
Here, we will focus on processing Leads, Opportunities, and Customers.
Leads
Search for and select “Leads Contacts (CRM)” and click ![]() .
.
The following screenshot reflects that only the very basic contact information is required to establish a Lead:

Click on the field, “ERC Primary Contact Name”, and choose “Yes”:

Within the Person Card (CRM) window, update the “Info” and “Contact Details” sections. Please note the data within the “Address” section will flow from the Lead Contact to the Primary Contact.

Scroll down to find “Person Timeline” and “Person Profile."
- “Person Timeline” is updated automatically by the application.
- “Person Profile” is an optional checklist, but checking its boxes provides valuable information for facilitating sales calls and meetings.
- For example, checking “Golf” in the “Hobbies” section prompts such questions as, “Did you book a tee time for this weekend?”.

Clicking “Close” returns you to the “Lead Contact Card (CRM)” window.
Upon scrolling down in “Lead Contact Card (CRM)”, you are brought first to a freeform note window:

Scrolling down further brings you to the “Profile and Checklist” section containing “Lead Profile”, “Checklist”, “Attached Documents”, and “Standard Documents”:

“Lead Profile” is a profile for the Company Contact itself – not the Person Contact.
If requirements are specified for converting the Lead into an Opportunity, then the boxes for “Completed for Leads” in the checklist should be marked.
Adding documents within “Attached Documents” is optional, while “Standard Documents” represents documents always distributed to the Lead.
If you want to send an e-mail to this potential customer, scroll to the top and click this button:
![]()
Doing so brings up a List window of one or more Email Templates to choose from:

After selecting the necessary template, update or enter any e-mail addresses and edit the Message if required:

Please note the Email Details window also offers helpful tools such as “Insert image” and “Insert hyperlink” options.
After clicking the "Send Email" button, the "Contact Timeline" on the Leads Contact (CRM) Card is updated by the content of the e-mail.
You can alternatively copy and paste text from an e-mail into this window, if you sent the e-mail from outside of the application, as shown here:

Opportunities
After updating the field “Estimated Contract Value”, convert the Lead into an Opportunity by clicking ![]() .
.


Search for and select “Opportunity Contacts (CRM)”, and click on the Contact in the “No.” column:

The “Opportunity Contact Card (CRM)” is shown below.

At any stage in the sales cycle such as “Opportunity”, you can add a note simply by clicking![]() .
.

The note requesting an Estimate, as in this case, appears in the Contact Timeline:

Estimates are quotes that do not require a customer or items. You can freely enter any data and convert the document to a Sales Quote or a Sales Order. (Estimates are simpler documents than Sales Quotes.)
To create an Estimate, search for and select “Estimates (CRM)” and click ![]() .
.
Tab out of the “Estimate No.” field, as the first step:

For the line item’s Type field, you may choose “G/L Account”, “Item”, “Resource”, “Fixed Asset”, or “Charge (Item)”:

After updating the header with complete information and entering at least one line item, you can e-mail the Estimate or print the Estimate. The following appears, upon clicking ![]() :
:

Here is the preview of the created Estimate:

Please note you can only convert the estimate into an order after converting this Opportunity into a Customer.
Customers
Back on the Opportunity (CRM) Card, turn the Opportunity into a Customer by completing the Checklist shown at the bottom if required:

Next, click ![]() .
.

When prompted, choose the appropriate template:


Search for and select “Estimates (CRM)”.
Then, click the link for your Estimate:

Scroll down to “Billing”, and choose the new Customer from the “Bill-to Customer No.” drop-down list:

Update “Client Info”, appearing at the top of the Estimate:

Now click ![]() .
.


Conversely, if the response to the Estimate was negative and the Contact does not want to proceed with an order, click “Lost”:

Wins and losses are tracked for estimates for historical reporting on success rate.
Search for and select “Sales Orders”, and click on the Sales Order that you just created:

Below is the final result.

By using Advanced CRM, you can see the full sales lifecycle from Lead to Opportunity to Customer. For more information about this add-on or other inquiries about maximizing your Business Central investment, please reach out to us at Support@BondConsultingServices.com or click here to schedule a free consultation with one of our Dynamics 365 experts.

Reporting on Business Central Using eOne's Query Builder
When it comes to business intelligence, anyone who has made the transition from Microsoft Dynamics GP to Business Central begins to miss the eOne Solutions SmartList Builder tool. SmartList Builder allows even the lay user to easily pull data from any GP table. Now, thanks to eOne’s Query Builder tool, users can pull data from any Business Central table with just as much ease.
Although the purchase of eOne’s Popdock is required to utilize Query Builder, this purchase will pay for itself once report designers see that they have a “one-stop shop” for reporting on any of Business Central’s data. The users who do not have access to Business Central can instead be given access to Popdock lists (or reports) created through Query Builder. Also, without Query Builder, there is no easy means of accessing Business Central tables.
In this hypothetical example, let’s say that you want to access amounts posted to Cost of Goods Sold, along with their sales invoice numbers and customer names.
From within Popdock, navigate to “Connectors”.

In this development environment, we would click the pencil icon to the far right of the connector option labeled “Dynamics 365 Business Central – John Sandbox”.

On the left, under Settings, select "Lists":

Scroll down to find "Query Builder" and click ![]() .
.
After entering a “Name”, click the tab button on your keyboard to default “Item name”, “Item singular”, and “API endpoint”. Next, choose the appropriate module for “Group”:

With this information entered, click the “Query builder” selection shown above.
Select “Click here to add a table”.

From the “Table” drop-down list, choose “G/L Account” and click “Add table”.

In the “Edit list - COGS” window, click “G/L Account” to choose any of the fields shown on the right.

*For this example, we will select “No”.
Within the G/L Account table that you added, click on “No.” On the right, choose “Click here to add a restriction”:

Not only does a drop-down list for “Type” appear in the Restrictions section on the right, but the “No.” field in the table now has a filter icon on its left:
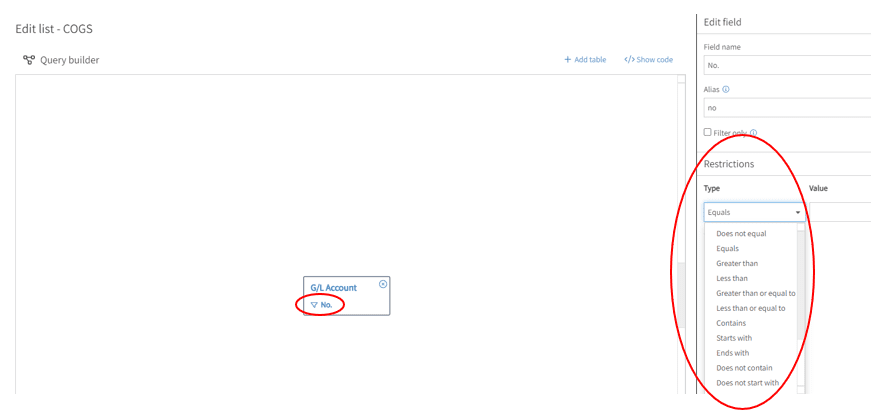
In “Restrictions”, choose Equals for “Type” and enter the Cost of Goods Sold account number from the general ledger for “Value”:

Next, click ![]() .
.

Here, you’ll search for G/L Entry within the “Table” drop-down list.
In “From field” and “To field”, you’ll choose the matching fields between the two tables to join them.
Next, click “Add table”.
(Again, those who know SmartList Builder in GP will be very familiar with this process.)
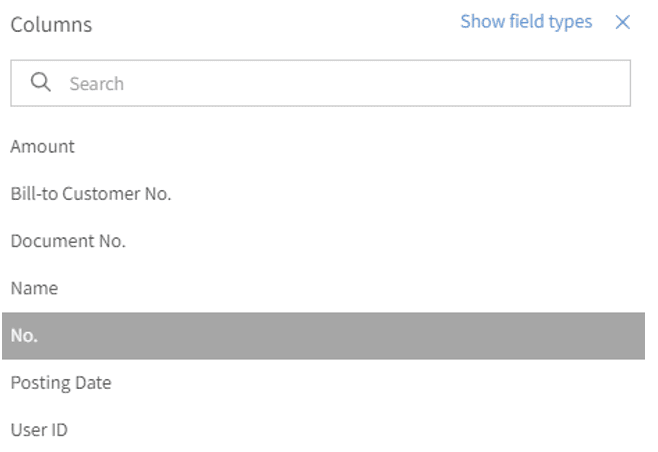
As you see here, you need to select fields for “G/L Entry”:

Once you click on “G/L Entry”, you can choose fields that appear for selection on the far right.
Choose “Amount”, “Document No”, “Posting Date”, and “User ID”. Your two tables will appear, as follows:

Now, you need to pull in customer data. Once again, click ![]() .
.
Here, you’ll search for “Sales Invoice Header” within the “Table” drop-down list.
In “From field” and “To field”, you’ll choose the matching fields between the two tables to join them.
After this, once again click ![]() .
.

Now, in the “Fields” section on the right-hand side of the window, select “Bill-to Customer No.” and “Name”. Now, here are your three tables:

In “Actions” on the left, click “Publish”:


After waiting for the dialog box shown above to disappear, you should get a message reporting success:

Select “OK”.
Return to the Popdock home page by clicking the logo in the upper left.
In the top middle of the home page, click ![]() .
.

As seen above choose “Find by connector”, update the five fields, and click “Add”.
Now, you’ll be taken to your report layout, where you can add fields.

Begin by selecting “No.” and clicking ![]()
Repeat this for the other fields to add:
The following is the result:

Congratulations you are now done. If you have any questions about this process or how to maximize your Business Central environment please reach out to us at Support@BondConsultingServices.com

Data Mining with Excel
Microsoft Dynamics 365 Business Central offers a wizard allowing you to conduct data mining. The Reporting Data Setup wizard is simple and exports data to Excel, providing you with the means to create pivot tables and charts based on Business Central data. We have provided the steps below to guide you in this process.
To begin, navigate to the Search icon in the top right-hand corner, and search for “assisted setup”.

After clicking Assisted Setup as shown above, find Set Up Reporting Data.


Then, click the Next button.

For creating a new report, you would of course select Create a new data set and then Next.

The choices for Data Source Type above are Page and Query. Choosing Query supports extracting data from one or more tables, making calculations, and outputting them. (Queries can be the source of Pages.)
Clicking the ellipsis button to the right of Data Source Id provides you with your choice of queries, such as Sales Order by Sales Person.

Enter a New Name without spaces and click Next.


When the list of fields appears, choose those that you want to see in your report.
Notice that you’re offered the buttons of Add Filters and Publish in the lower right. Filtering is optional, and the Filter Page window is shown here.

The final window of the wizard shows the OData URL that you created, along with the Excel button in the lower right.

After clicking Excel and opening the spreadsheet, you’ll need to login with your Business Central credentials.

Data for the Sales Order by Sales Person spreadsheet will, then, populate as shown at the top of the next page.

At this point, you can take advantage of such reporting tools in Excel by filtering.

Creating PivotTables and PivotCharts based on data exported from Business Central is easy and is accomplished by clicking the Insert menu, as seen in the following two windows.


Making the appropriate choices in PivotTable Fields on the right shows how much money was made in which year and for which inventory item.

Clicking the PivotTable Analyze menu and, then, Insert Slicer lets you filter and see sales made by each salesperson for each time period.


The PivotTable Analyze menu also allows you to create Pivot Charts. In the bar code selection shown here, you can create a 2D bar chart.

This PivotChart shows sales made by Annette Hill. This filtering is accomplished, by clicking the Name drop-down list in the upper left of the chart.

For any questions about Data Mining using Excel, please reach out to us at Support@BondConsultingServices.com or you can also schedule a free consultation with one of our Dynamics 365 experts to see how you can maximize your Business Central investment.

Statistical Accounts in Business Central version 22
Version 22 of Business Central introduced functionality for Statistical Accounts, a long-waited functionality already available in other accounting systems. It will allow you to post statistics that could be used in Financial Reporting.
Defining Statistical Accounts
Search Statistical Accounts and select the suggested link.

Click on the +New button to define a new account

In No., enter a code of up to 20 characters and a descriptive text in Name.
The No. could be a word or a numerical value, for example, 9001.

Use the Dimensions button to define default Dimension Values if required.
Posting Entries to Statistical Accounts
From the Statistical Accounts list, use the Statistical Accounts Journal, or use the global search to find it. Like other Journals, enter the Posting Date, Document No., Account No., and the quantity in the Amount field; the Description is a free entry; enter Dimension values if required.

Enter Dimension Values if required.
Once the data is ready, use Register to register the information on the Statistical Account Ledger Entries page.

If a mistake was made, the Statistical Account Ledger Entry page allows you to reverse entries; select the record(s) to reverse and click "Reverse Transaction."
Using Statistical Accounts in Financial Reports
In Business Central's Financial Reporting, select a report, for example, the Balance Sheet, and choose Edit Row Definition.

Alternatively, search "Row Definitions" and open the "Row Definition" to update. This update adds new rows to all reports using the same Row Definition.

For the Totaling Type, select Statistical Account.

Close the Row Definitions page and run the Financial Report to see the new rows.

Statistical Accounts in Analysis Views
In Analysis Views, you can also run an analysis on Statical Accounts. In Account Source, select "Statistical Account" and select the accounts in Accounts Filter, then add the Dimensions you want to use.

For more information about statistical accounts or how to maximize your Business Central investment you can reach out to us at Support@BondConsultingServices.com or click here to schedule a free consultation with one of our Dynamics experts.

How-to Connect to Business Central Data with Excel
Microsoft Dynamics 365 Business Central offers several ways of producing refreshable reporting in Excel. Not only is new and updated data displayed in Excel with the click of a button, but you can also easily create a “card” for the spreadsheet containing data in an easy-to-read format. For example, let’s say that you’re a collections manager wanting to review customer balances and contact information.
First, navigate to the Web Services window in Business Central where you will find the list of OData links.


After locating the OData feed for the Customer Card object, copy the link. Now that the OData feed is copied to the clipboard, create a new spreadsheet, and select Get Data > From Other Sources > From OData Feed.

Then paste the OData link, as shown below, and click OK:

When the next window appears, click the Transform Data button.

As seen here, Excel’s Power Query Editor opens.

To collapse several columns into a card for the refreshable collections report, ensure that the No column is still highlighted and CTRL Click on the following columns in this order:
- Search_Name
- Salesperson_Code
- Address
- Address_2
- City
- Post_Code
- Phone_No
- MobilePhoneNo
- E_Mail
- Name
The following screenshot shows an example of CTRL Clicking the columns.

Next, click the Transform menu and the Create Data Type button found on the far right.

In Create Data Type, enter the name of the new column in the Data type name field and click OK.

If the above steps in the Power Query Editor were performed correctly, the Customer column will appear with a double-headed button.
![]()
Return to the Home menu and click the Close & Load button to exit Power Query Editor.

The final product in Excel will appear similarly to the screenshot below, showing the Customer Data Type column and icon.

Clicking on the Data Type icon displays a card containing the fields earlier selected in Power Query Editor. This is shown in the screenshot displayed below.
As a collections manager, you will not have to scroll through several columns to get pertinent data such as the Salesperson Code and customer contact information.

Contacting Trey Research later this week or later in the month about the $52,666,56 balance is, obviously, a very important collections activity. Immediately, however, you see that there is no phone number associated with the Customer Card in Business Central.
After having the A/R department enter Trey Research’s phone number in Business Central, you can refresh the spreadsheet to make it easier to later contact this customer without having to open Business Central.
Simply click the Data menu and, in Queries & Connections, click the Refresh All button.

The next time that you click the Data Type icon, Trey Research’s phone number will now appear in the card.

Fields in the spreadsheet but outside of the card will, also, be updated for any new or updated data in Business Central. For instance, if A/R personnel change the customer’s credit limit, the Credit_Limit_LCY column will change upon refreshing the report.
Four Tips for Better Use of Excel Refreshable Reporting
- Keyboard Shortcut
- The keyboard shortcut Ctrl+Shift+F5 can be used, in lieu of clicking on the Data Type icon.
- Not Seeing Updated Data?
- If you do not see any changes from Business Central reflected in the spreadsheet, give the spreadsheet a reasonable amount of time to update. Also, if you alone made the changes within Business Central, refresh Business Central’s browser on your workstation or laptop. Then, refresh the spreadsheet
- Closing and Reopening the Report
- Simply closing and reopening the report will refresh the report as well.
- Order of Columns in Power Query Editor
- The last column that you select in Power Query Editor should represent the approximate location of where you want the combined Customer Data Type column to appear in your refreshable spreadsheet.
For any questions on this process or about Business Central in general, please reach out to us at Support@BondConsultingServices.com or click here to schedule a free consultation with one of our Business Central experts.
Simplified Management of Item Tracked Inventory using an Item Journal
With the release of Business Central version 22, Microsoft has simplified the steps when entering inventory that has item tracking required. Depending on the warehouse configurations of a customer, there are two new options available:
- You can enable specific batches on the Item Journal page to let people enter serial, lot, and package data directly on journal lines.
- For locations where the Directed Put-away and Pick toggle is turned on, you can use the Warehouse Physical Inventory Journal page to make all item tracking fields available. The fields that are available now include the Warranty Date and Expiration Date fields.
For the item journal, you will now find an option where you can enable the item tracking fields within the line.
![]()
With the option enabled the Lot No., Serial No., Expiration Date, Warranty Date, and Package No. fields will be available to enter directly on the line instead of having to open the item tracking lines page for each line.
![]()
The Warehouse Physical Inventory Journal will also include the same fields now for simpler entry of item tracked inventory.
![]()
With this new release the loading of opening item balances will be more efficient and allow for the use of templates directly into the item tracked fields.
For more information about the new update check out these other blogs that discuss new features of the update.
And as always, for additional information on this new feature or questions regarding Business Central, you can contact support@lime-falcon-860444.hostingersite.com.

How-to Reconcile Inventory
Inventory reconciliation is the process of comparing your company's physical inventory to its recorded inventory in the accounting system. It helps your business to ensure the accuracy of your inventory data and identify discrepancies that may indicate theft, shrinkage, or other operational issues.
The inventory reconciliation routine checks the tables and transactions to ensure that the totals, quantities, and transactions are correct. It is a tool that should be run regularly to ensure that there are no issues with inventory which relate to sales and purchases. The reconciliation can run for every item or a specific item that is no longer totaling correctly.
Please see the below key steps on how to reconcile inventory.
- Have System Admin/ IT team take a backup of any database that will be reconciled
- Have all users log out of the system besides the user running the reconcile
- Navigate to the Inventory Reconcile (Tools -> Utilities -> Inventory -> Reconcile)

- You can select to run for all items or a range of items
- Select Process
- Note: If reconciling all items, this can take multiple hours depending on how many items there are in the system.
- A report will be available to print with a detailed list of all of the changes
For more information on this process or how to maximize your Dynamics GP investment, please reach out to us at Support@BondConsultingServices.com or Click Here for a Free Consultation with one of our Microsoft certified experts.

Using the new Invoice Posting Policy from version 22
With the release of Business Central version 22, Microsoft has included the ability to specify how each user can process invoices. Companies can have different processes for shipping/receiving and invoicing, so now you can restrict the options by the user.
On the User Setup page, you will now find the following fields Sales Invoice Posting Policy and Purchase Invoice Posting Policy fields, which will allow for restricting of posting or require the invoices to post together with the shipment/receipt. You can choose one of the following options:
- Allowed (Default): Keep the current behavior, where a user can choose the posting option, such as Ship, Invoice, and Ship and Invoice.
- Prohibited: Prevent the user from posting invoices. Business Central will show a confirmation dialog that provides only the Ship or Receive options.
- Mandatory: Allow the user to post invoices together with receipts or shipments. Business Central will show a confirmation dialog with the Ship and Invoice or Receive and Invoice options.

The new settings affect the following document types in Business Central:
- Sales orders
- Sales return orders
- Purchase orders
- Purchase return orders
- Warehouse shipments
- Inventory picks
- Inventory put-aways
Here are some examples of how specific document types are changed with the new settings.
| Document | Option 1: Allow Displays a series of options |
Option 2: Prohibited Confirmation dialog |
Option 3: Mandatory Confirmation dialog |
| Sales Order | - Ship - Invoice - Ship and Invoice |
Do you want to post the shipment? | Do you want to post the shipment and invoice? |
| Purchase Order | - Receive - Invoice - Receive and Invoice |
Do you want to post the receipt? | Do you want to post the receipt and invoice? |
For additional information on this new feature or questions regarding Business Central, please contact support@lime-falcon-860444.hostingersite.com or click here to schedule a free consultation with one of our expert consultants.