
How to Move from Microsoft Dynamics GP to Business Central: Migration Guide
Thinking of moving from Dynamics GP to Business Central? You're not alone. Thousands on companies are exploring a modern, cloud-based ERP to replace Dynamics GP. In this guide, we'll walk you through the process of migrating to Dynamics 365 Business Central - including what to expect, how it works, and key tips for a smooth transition.
Why are companies moving on from Dynamics GP?
If you're considering a move, you're likely motivated by one of more of these things:
- End of mainstream support for Dynamics GP
- Desire to move to a cloud-based ERP system
- Integration with Microsoft 365 and Power Platform
- Modern user experience and automation capabilities
Two approaches to moving from GP to Business Central
There are two main ways to move from GP to Business Central:
- Reimplementation - Create a Business Central instance from scratch and manually migrate data from GP
- Use the Cloud Migration Tool - Link Business Central to Dynamics GP and import the data programmatically
Based on the above description, it seems like the better approach to just automatically import all your data from Dynamics GP, but there are some things to first consider before deciding on an approach.
How does the GP Cloud Migration Tool Work
What data is migrated with the Cloud Migration Tool?
If you're not planning on making any changes to your data structure during your move to Dynamics 365 Business Central, then the Cloud Migration Tool might be for you.
The following data will be migrated by the tool:
- General ledger (including, but not limited to)
- Main G/L Account Segment and Other Account Segments*
- Summarized transactional data
- Fiscal Periods
- Open Years
- Checkbook Master
- Sales / Accounts receivable (including, but not limited to)
- Salespeople
- Customers and Addresses
- Open A/R (remaining amounts only)
- Purchasing / Accounts payable (including, but not limited to)
- Vendors and Addresses
- Open A/P (remaining amounts only)
- Open Purchase Orders (remaining quantities only)
- Inventory (including, but not limited to)
- Item Master
- Quantity on Hand (blank location)
- Locations
- Serial/Lot Information
- Other items (not exhaustive)
- Payment Terms
- Shipping Method ID
- Additional Customer and Vendor Ship To and Order Addresses
- Vendor EFTs and
- “Vendor Remit” as Main Address.
*Although all account segments will be imported the main segment will be imported directly into Business Central’s Chart of Accounts, while the other account segments will be imported as Dimensions.
What data ISN'T migrated with the Cloud Migration Tool?
The following items are not included when using the Cloud Migration Tool:
- Inventory Bill of Materials
- Project Accounting Data
- Manufacturing Data
- Field Service Data
- Payroll Data
- Detailed GL history (only summarized historical tranasctions are migrated)
Cloud Migration Tool prerequisites
- GP 2015 and later versions
- SQL Server 2016 and later versions
- Individual database size less than 80 GB
This doesn't mean that a company that conflicts with any of the above items can't use the Cloud Migration Tool for the remainder of their data, it just means that some additional manual effort will be required. We at Bond Consulting Services have done a lot of these more complex GP to Business Central migrations; you can reach out to us if you need some help.
Where can you review the data from the Cloud Migration Tool?
The Cloud Migration Tool imports the data into separate extension tables. These data are kept separate from the data that's created in Business Central, but they'll be visible from the same forms. The following data is migrated into extension tables:
- Receivables Transactions
- Sales Transactions (Quotes, Orders, Invoices, Returns)
- Sales Line Items
- Payables Transactions
- Purchasing Transactions
- Receiving Line Items and
- Inventory Transactions.
To see the data, navigate to the appropriate list page and select one of the new GP data views (as seen below).

Once you navigate to one of those pages, you'll see the transactions are loaded, but there is no drill down available, and the source transactions cannot be reprinted.

Best Practices for Migrating from GP to Business Central
Here's a list of things that we like to consider best practices when migrating from GP to Business Central:
- Perform a full system design to make sure that you are taking advantage of all of Business Central’s functionality.
- Use GP’s Professional Services Tools Library (PSTL) or Corporate Renaissance’s Changer to make all master record changes, including account segments, before you move to Business Central. All changes will be rolled into historical transactions.
- Rename your Account Segment descriptions to alphanumeric Dimensions to assist with data entry. For example, rename Segment 1 to “Division”.
- Within Business Central, there are two Global Dimensions and six Shortcut Dimensions. Determine which two segments of the chart of accounts best represents your business processes and make those to be the two Global Dimensions.
- Run all applicable Check Links and reconciles, prior to migration.
- Run a query against customer telephone number fields, to verify that there are no non-numeric characters in the telephone number. Correct any errors that are found.
- Even if Multicurrency is not being used in your GP installation, configure multicurrency access for each currency by navigating in GP to Administration --> System --> Multicurrency access.
- Also, configure Functional Currency in Financial --> Setup --> Multicurrency setup
- Run Check Links against the Multicurrency Setup and Period Setup series of tables.
- Maintain access to your on-premise GP server for a reasonable amount of time in case you ever need to refer to source documents.
Ready to Make the Move?
Migrating from Dynamics GP to Business Central doesn't have to be complicated — and you don't have to do it alone. At Bond Consulting Services, we’ve helped hundreds of businesses plan and execute successful ERP transitions.
Let’s talk about your migration goals and create a roadmap that fits your business.

How-To Change the Format of the Invoice Email
Recently one of our clients had an issue sending out reports in a custom template that was different than the default report. An administrative user need only to follow these steps for the solution as well as viewing all of your custom report templates at a glance. Essentially, the admin user will be setting the desired report template as the default, so that when the email is created it would be in the correct format.
This method can be used for any type of report including invoices and quotes. If it is only a one-time send, then this process may be repeated to reselect the original template as the default and return to business as usual.
Here are the detailed steps to the solution:
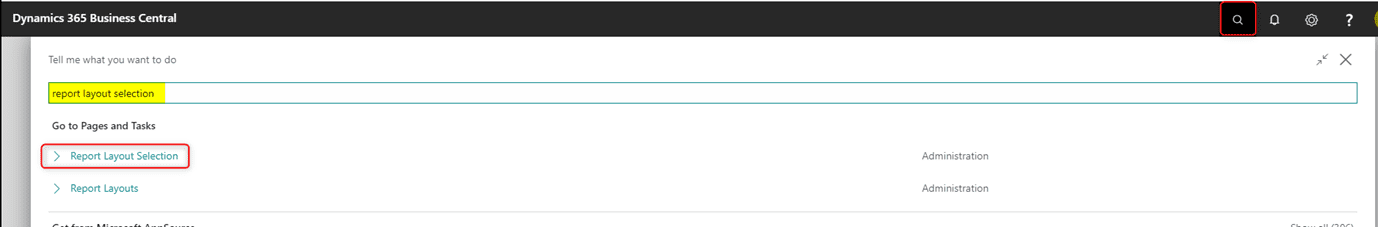
- Begin by navigating to the Report Layout Selection page. Click the Search icon and type in Report Layout Selection. Then, select the Report Layout Selection link.
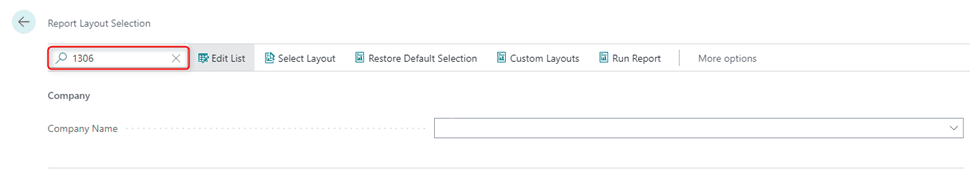
- Within the search, type in 1306 (for a Sales Invoice modification)
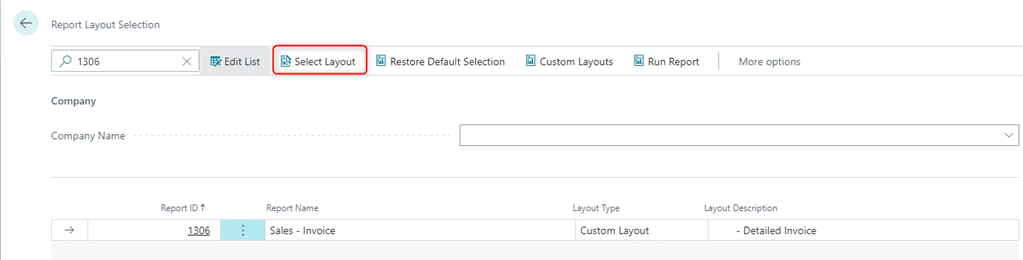
- Click Select Layout
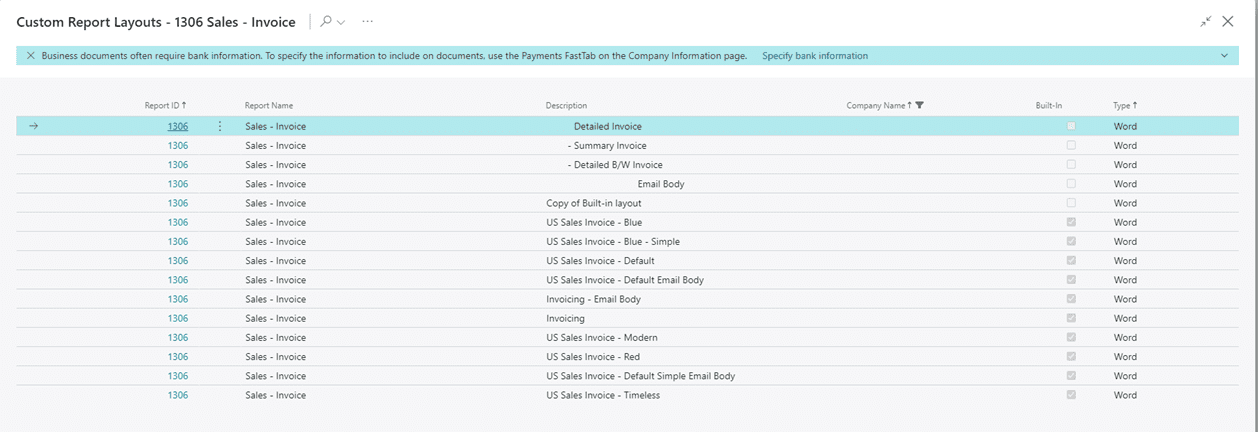
- Then, from the below list, select the Summary Invoice. Then click Ok.
To change it back to the Detailed invoice, you may start from step 3 and change it back to the Detailed Invoice.
For more information on this process or questions about Microsoft Dynamics 365 Business Central capabilities, please reach out to us at Support@lime-falcon-860444.hostingersite.com or click here to schedule a free consultation with one of our experts.

Visualizing Data and Creating Detailed Reports
Microsoft Power BI presents data from Business Central graphically, as shown here:

The remaining pages of this blog discuss (a) extracting this data and (b) using Visualizations to present the above report for end users and stakeholders.
Seeing Business Central expressed graphically allows for better understanding of its data and emphasizes the usefulness of Power BI.
Extracting Business Central Data
From the “Home” tab of Power BI Desktop, take the following steps:
- click “Get Data”,
- choose “More”,
- select “Online Services”,
- pick “Dynamics 365 Business Central”, and
- click the “Connect” button:


Within the “Navigator” window, find the production instance of Business Central:
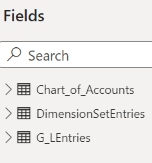
 After selecting “Web Services (legacy)” within the company database, click its checkboxes to choose the following three tables:
To properly join these tables, choose the “Model” button on the lefthand side of the Power BI Desktop (three boxes with workflows):
![]()
And, join these three tables as shown here:
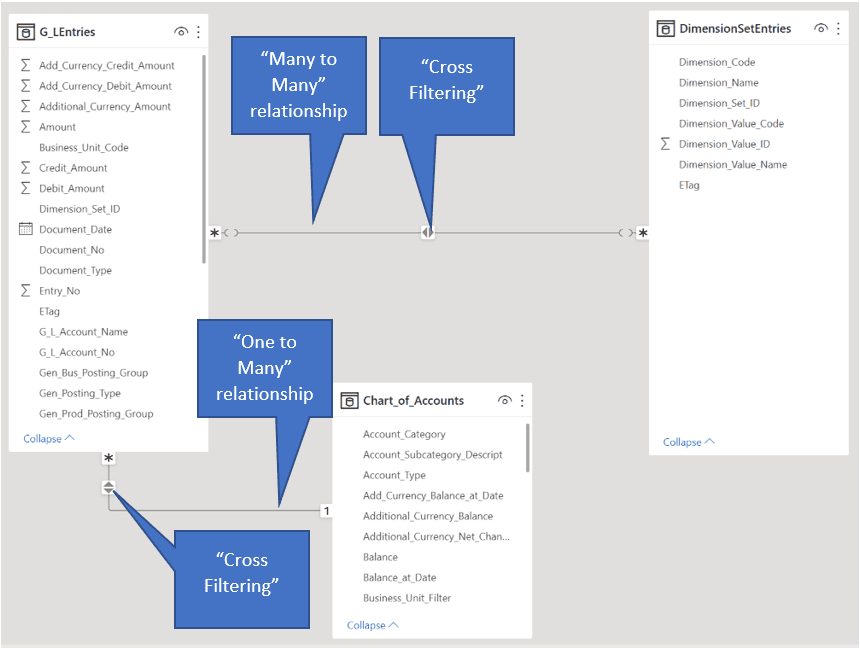
A Many to Many relationship exists between the “G_LEntries” and “DimensionSetEntries” tables based on the on “Dimension_Set_ID” field.
Of course, the “G_LEntries” and “Chart_of_Accounts” tables are joined within a One to Many relationship based on the “G_L_Account_No” and “No” fields respectively.
Using Power BI Visualizations
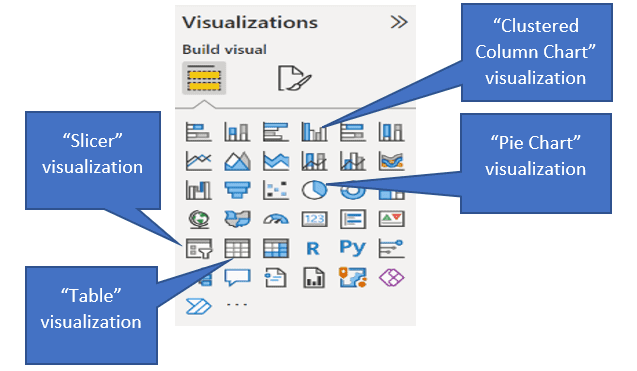
The “Visualizations” panel on the righthand side of the Power BI Desktop displays the visualizations used in this report. The remainder of this document outlines the properties of each Visualization.
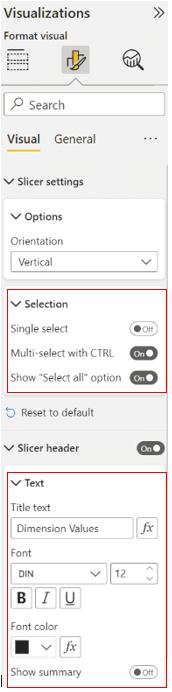
Slicer
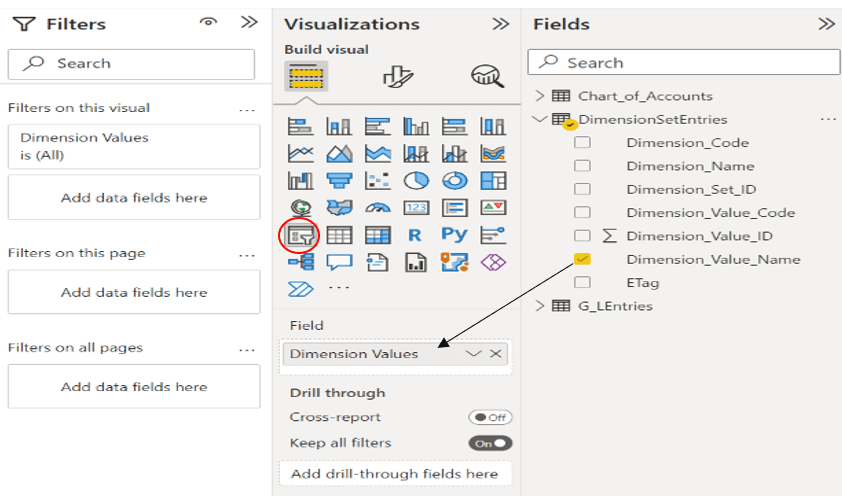
After dragging the “Dimension_Value_Name” field into the Slicer Visualization, the field was renamed to “Dimension Values” as shown above.
The final page of this document displays the formatting of the Slicer.
Pie Chart
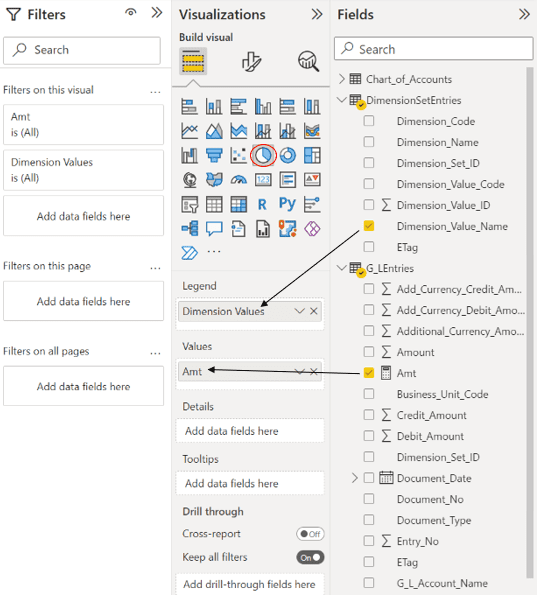
Clustered Column Chart
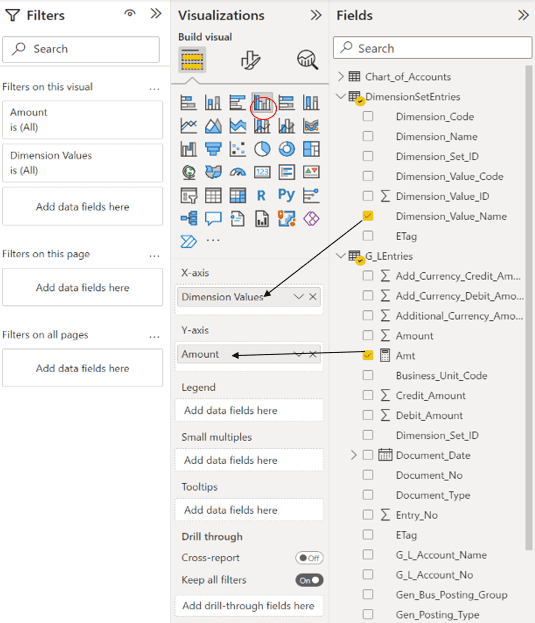
After dragging the “Amt” field into the Clustered Bar Chart Visualization, the field was renamed to “Amount” per the screenshot above.
The following formula was used to create the “Amt” field used in this and other Visualizations:
Amt = SUM((G_LEntries[Amount])) * -1
Table (Summary)

The red circle above shows how filtering of the “Account Category” field of the Chart_of_Accounts table was conducted for Cost of Goods Sold and Income accounts.
The screenshot at the top of the next page shows the fields, from the G_LEntries table, used and renamed in this Table Visualization.
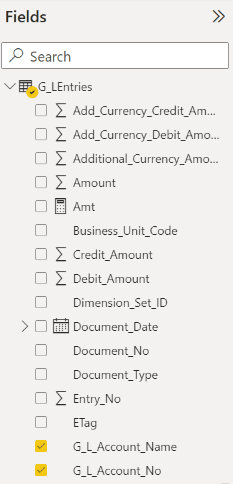
Table (Detail)
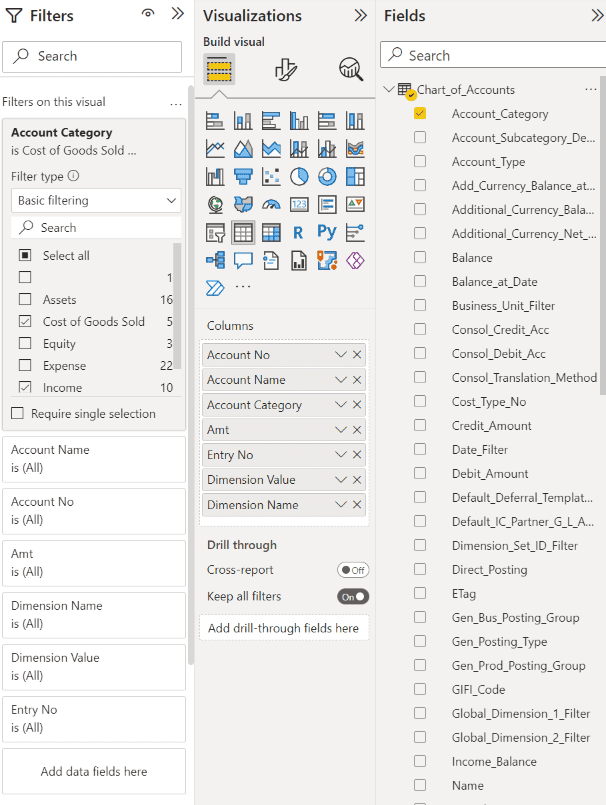
Here are the fields from the “DimensionSetEntries” and “G_LEntries tables” used and renamed in the detailed Table Visualization displayed on the previous page:
Formatting of the Slicer
For more information about Power BI and reporting customization please reach out to us at Support@BondConsultingServices.com or schedule a free consultation with one of our experts by clicking here!

How-To Automate Importing Data Sets from an FTP Site
Instead of manually entering every record for a new data set, you can set up a process to automatically import a bulk spreadsheet of data from an FTP site and map each attribute to the corresponding field in Dynamics 365 Sales. This method is scalable, it saves time and will reduce entry errors to ensure the highest quality data in your system. D365 Sales is the data warehouse and Power Automate connects and integrates the data while checking for errors in the report. This method utilizes an FTP site meant for transferring data. The FTP site connects with Power Automate and CRM to run the necessary checks and import the data.
Using Power Automate, you can set up approval processes to remedy any errors in the data if it does not match up to your CRM specifications. This approval process sends a notification to a designated user whenever the system detects an issue or discrepancy in the data.
Note: PDF data can be converted to a spreadsheet file using Power Automate and similarly uploaded into the database
For more information on Microsoft Dynamics 365 Sales CRM or questions about how to set up this solution, you can reach out to us at Sales@lime-falcon-860444.hostingersite.com or schedule a consultation here with one of our experts.

How-To Add the Date Posted Field into a SmartList
We have recently received several inquiries on obtaining information as to when specific accounting entries have actually been posted, as opposed to the GL transaction posting date. Getting this information from Dynamics GP is not that difficult, so follow these steps to solve the problem.
In the example below, we will be using SmartLists to get this information, as well as journal entry description information. Since the names of the columns within SmartLists are a bit vague, it helps to have this little bit of insight:
- Originating Posted Date -> This is the date that the transaction was originally posted
- Reference -> This relates to the journal entry descriptions, as well as the distribution reference that is entered at the subledger level
If you’re up for the challenge, the modifications are as follows:
- Expand on the Financial folder, then expand on the Account Transactions folder, and select the * option to start with a standard view.

- Click on the Columns button to open the Change Column Display window and then click on the Add button.

- Within the Columns window, locate and select the ‘Originating Posted Date’ column and then click the OK button.

- Repeat the same steps to locate the ‘Reference’ column and then click the OK button once again.

- Once the two columns are added, you can select the column description and adjust the placement/ order on the SmartList by selecting the column Display Name checkbox and then moving the placement up (or down) using the arrows on the right-hand margin.

- Once the order is set, you can click on the OK button to have the SmartList refreshed.

- When the SmartList reappears, it will have the new columns in the selected order.

- Save your changes by clicking on the Favorites button and saving the SmartList with an easily identifiable name. As a last set of steps, click Add and Add Favorite to save the SmartList.

- In order to adjust the amount of information being gathered by the SmartList, you will need to enter some search parameters; this can be done by clicking the Search button.

- Within the Search Account Transactions window, you can enter a range on the TRX Date column, which is the GL date. Additionally, you can adjust the number of records that can be displayed within this SmartList. Click OK to close this window and view the data results in the SmartList window.

- In order to maintain the information you have assembled, we recommend saving the changes one last time by clicking on the Favorites button within the SmartList window and clicking the Modify button.

If you have gotten this far, great work! The same principles can be applied when adding new columns to existing SmartLists. If you have any more questions about this process or Dynamics GP in general, please reach out to us at Support@BondConsultingServices.com!

Using Mover.io to Migrate to Microsoft 365
One of the most important parts of the integration process is the Data Migration. In this step all of your company’s most important data is transferred to the new environment. Whether you are moving to Office 365, OneDrive, or another Microsoft tool, Mover.io can facilitate the transition with ease and quickness. Mover.io is a Microsoft owned app that offers more convenient ways to accomplish a migration. Traditionally, complex data migrations take many hours to transfer all of the relevant data, but with Mover.io transfer speeds are significantly reduced.
First this tool was originally used for SharePoint and SharePoint online, and now it is available to with DropBox, Google Cloud Storage, Amazon S3, or any of the below listed authorized source connectors.

There are numerous benefits to using Mover for your migrations. Mover saves properties and permissions for all individual users as long as the user moves to the new system as well. Mover also migrates individual OneDrive Folders user by user and can be done for the whole company. If it is a set of specific users, this tool is best for those kinds of scenarios. In addition, Mover has the option to condense down files and it only requires a global admin from the source and designation.
For more information about how your company can migrate to Microsoft 365 using Mover, reach out to us at Support@BondConsultingServices.com.

Why Do PDF Jobs Freeze When Printing Documents
Just after completing an upgrade to Dynamics GP 18.4 recently, we ran across an issue where Adobe Acrobat seemed to be freezing up on the RDS server whenever users attempted to print Sales Order Processing documents. When we researched the recommended version of Adobe Acrobat, the system requirements document pointed us to an old version of Adobe Acrobat and was no help.
All we really knew is that Dynamics GP 18.4 was not printing sales documents, but upon the completion of testing, we found that all other documents seemed to be printing to a PDF file perfectly fine. Of course, all of the other reports/ documents were only text documents without logos or barcodes.
When researching the printing issue, we found plenty of documentation telling us to verify that the ‘Rely on system fonts only; do not use document fonts’ checkbox option is marked under the Adobe PDF Printing Preferences window. We verified that the recommended checkbox was marked, but that setting was getting us nowhere.

Out of curiosity we ended up taking the opposite approach. We left the box unchecked, and while testing we found that the heavily modified sales order processing documents did not freeze up and successfully converted to PDF files. Not having the box checked fixed the problem. We hope this approach saves you some time and frustration, as there is not a whole lot of information written about troubleshooting PDF printing issues out of Dynamics GP.
If you are encountering a similar error or if you would like more information about Dynamics GP or any Dynamics 365 product please reach out to us at Support@BondConsultingServices.com.

How-To Copy and Paste Data from Excel into Business Central
In Dynamics 365 Business Central you have the ability to copy and paste from Microsoft Excel to the General Journal. The information below will highlight the quick and convenient way to complete this task.
Important to Note:
- Create an Excel worksheet with the same columns as configured on the General Journal. The General Journal can be personalized.
- Dimension Codes should be placed after the last Account No./Bal. Account No. fields. If an Account No. or Bal. Account No. field is populated after the dimension codes, the dimension codes will be blank.

![]()
- In Excel, select the data to be copied to Business Central and right click to copy ( or use CTRL + C).

- Select the leftmost cell on an empty line on the Business Central General Journal and right click to Paste (or use CTRL + V).

- Some or all rows can be deleted and re-imported.
- The following transaction is the same as above except that the offsetting account 10200 is entered to Bal. Account No. where Bal. Account No., above, is blank


For more information on the Business Central General Journal please reach out to us at Support@BondConsultingServices.com or click here to schedule a free consultation with one of our Business Central experts.

Filtering the Chart of Accounts Balances by Date
The Chart of Accounts list balances (totals) can be filtered by date.
To filter by date, personalize the view to display the “Balance at Date” column. In the example, below, the Net Change and Balance at Date totals columns are filtered by the date filter. Note that the totals can be further filtered by other available options such as global dimension values.
Note that the View/Filter can be saved for future use.
 Drill down to related detail by selecting the hyperlink amount in the following columns.
Net Change = Total value for the range of the date filter.

Balance at Date = Balance at the end of the date filter.
Balance = Current balance.

The Balance at Date column is also available on the Bank Account list which makes it easy to verify balances, by date, between bank accounts and related cash accounts.
 Totals on other lists like Vendors and Customers can also be filtered. For more information about Business Central capabilities and customizations contact us at Support@BondConsultingServices.com or click here to schedule a free consultation with one of our Dynamics experts.

How-To Report on Business Central Dimensions Using Power BI
Dimensions are important reporting tools in Dynamics 365 Business Central. With Dimensions in place, you won’t have to set up separate accounts within the General Ledger for important areas of the business such as customer groups and departments. Instead of tracking customer groups and departments as General Ledger accounts, you can track them simply as additional categories.
Ledgers within Business Central process transactions for an unlimited number of Dimension values. Default Dimension values are assigned to master data records such as General Ledger accounts, customers, vendors, fixed assets, resources, and items. These Dimension values are used in Business Central filters, in financial statements, and in data sent to Power BI.
The following is a Power BI Dashboard containing five visualizations, based on the Dimensions called “Customer Group” and “Department”:
 The Slicer, in this Dashboard, allows the end user to select all or some of the Dimension values.
For example, here is what the Dashboard looks like when only the Sales and Administration departments are chosen:
 The Slicer filters the other four visualizations, on "Sales" and "Administration".
Designing a Dimension Dashboard

These tables are used to create this Dashboard: Chart_of_Accounts, DimensionSetEntries, and G_LEntries.
The DimensionSetEntries table is particularly important. Using the DimensionSetEntries table is a must if you are to report on Dimension values in Power BI.
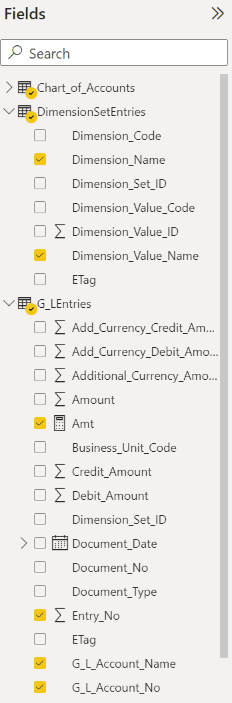
Fields Used for Dimension Reporting
Chart_of_Accounts
- Account_Category (renamed as “Account Category”)
- Balance (the basis for the “Sum of Balance” in the summary Table visualization)
DimensionSetEntries
- Dimension_Name (renamed as “Dimension Name”)
- Dimension_Value_Name (renamed as “Dimension Value”)
G_LEntries
- Entry_No (renamed as “Entry No”)
- G_L_Account_Name (renamed as “Account Name”)
- G_L_Account_No (renamed as “Account No”)
Facilitating Dimension Reporting
The key to providing accurate Dimension value reporting in Power BI lies in the table relationships shown in the screenshot below.
Shown here, a "Many to Many" relationship exists between the "G_LEntries" and "DimensionSetEntries" tables based on the on “Dimension_Set_ID” field.
Of course, the "G_LEntries" and "Chart_of_Accounts" tables are joined within a One-to-Many relationship based on the “G_L_Account_No” and “No” fields respectively.

Issues with Presenting Pie Charts
The Dashboard contains both a Pie Chart and a Column Chart and it will illustrate the two important concerns in presenting Pie Charts in analytics.
Even outside of the use of Power BI, Pie Charts are not very readable. This is especially true, when many categories of data are being presented. Visually, it’s very difficult for the recipient of such a report to tell the difference between a slice of the pie that is 7% of the data and another slice that is 8%.
And, in the case of our Dashboard, you may have noticed that the Column Chart displays data for two Dimension values that the Pie Chart does not – “Large Business” and “Medium Business”. This occurs, because of one important caveat of Power BI - negative values aren’t supported in Pie Charts. In these cases, negative values are displayed as zeroes. This, in essence, means that they are not seen in the Pie Chart.
Power BI Developers should rarely use Pie Charts and should instead make use of such visualizations as Column Charts, Bar Charts, and Line Charts.

For more information or any questions you have about Dimension Reporting in Dynamics 365 Business Central please reach out to us at Support@BondConsultingServices.com or click here to schedule a free consultation with one of our experts.